 0207 0787 247
 0207 0787 247


The Beauty Of Maths Patterns: Exploring Mathematical Sequences
Apr 17, 2024 |
The Beauty of Maths Patterns: Exploring Sequences | Mathnasium

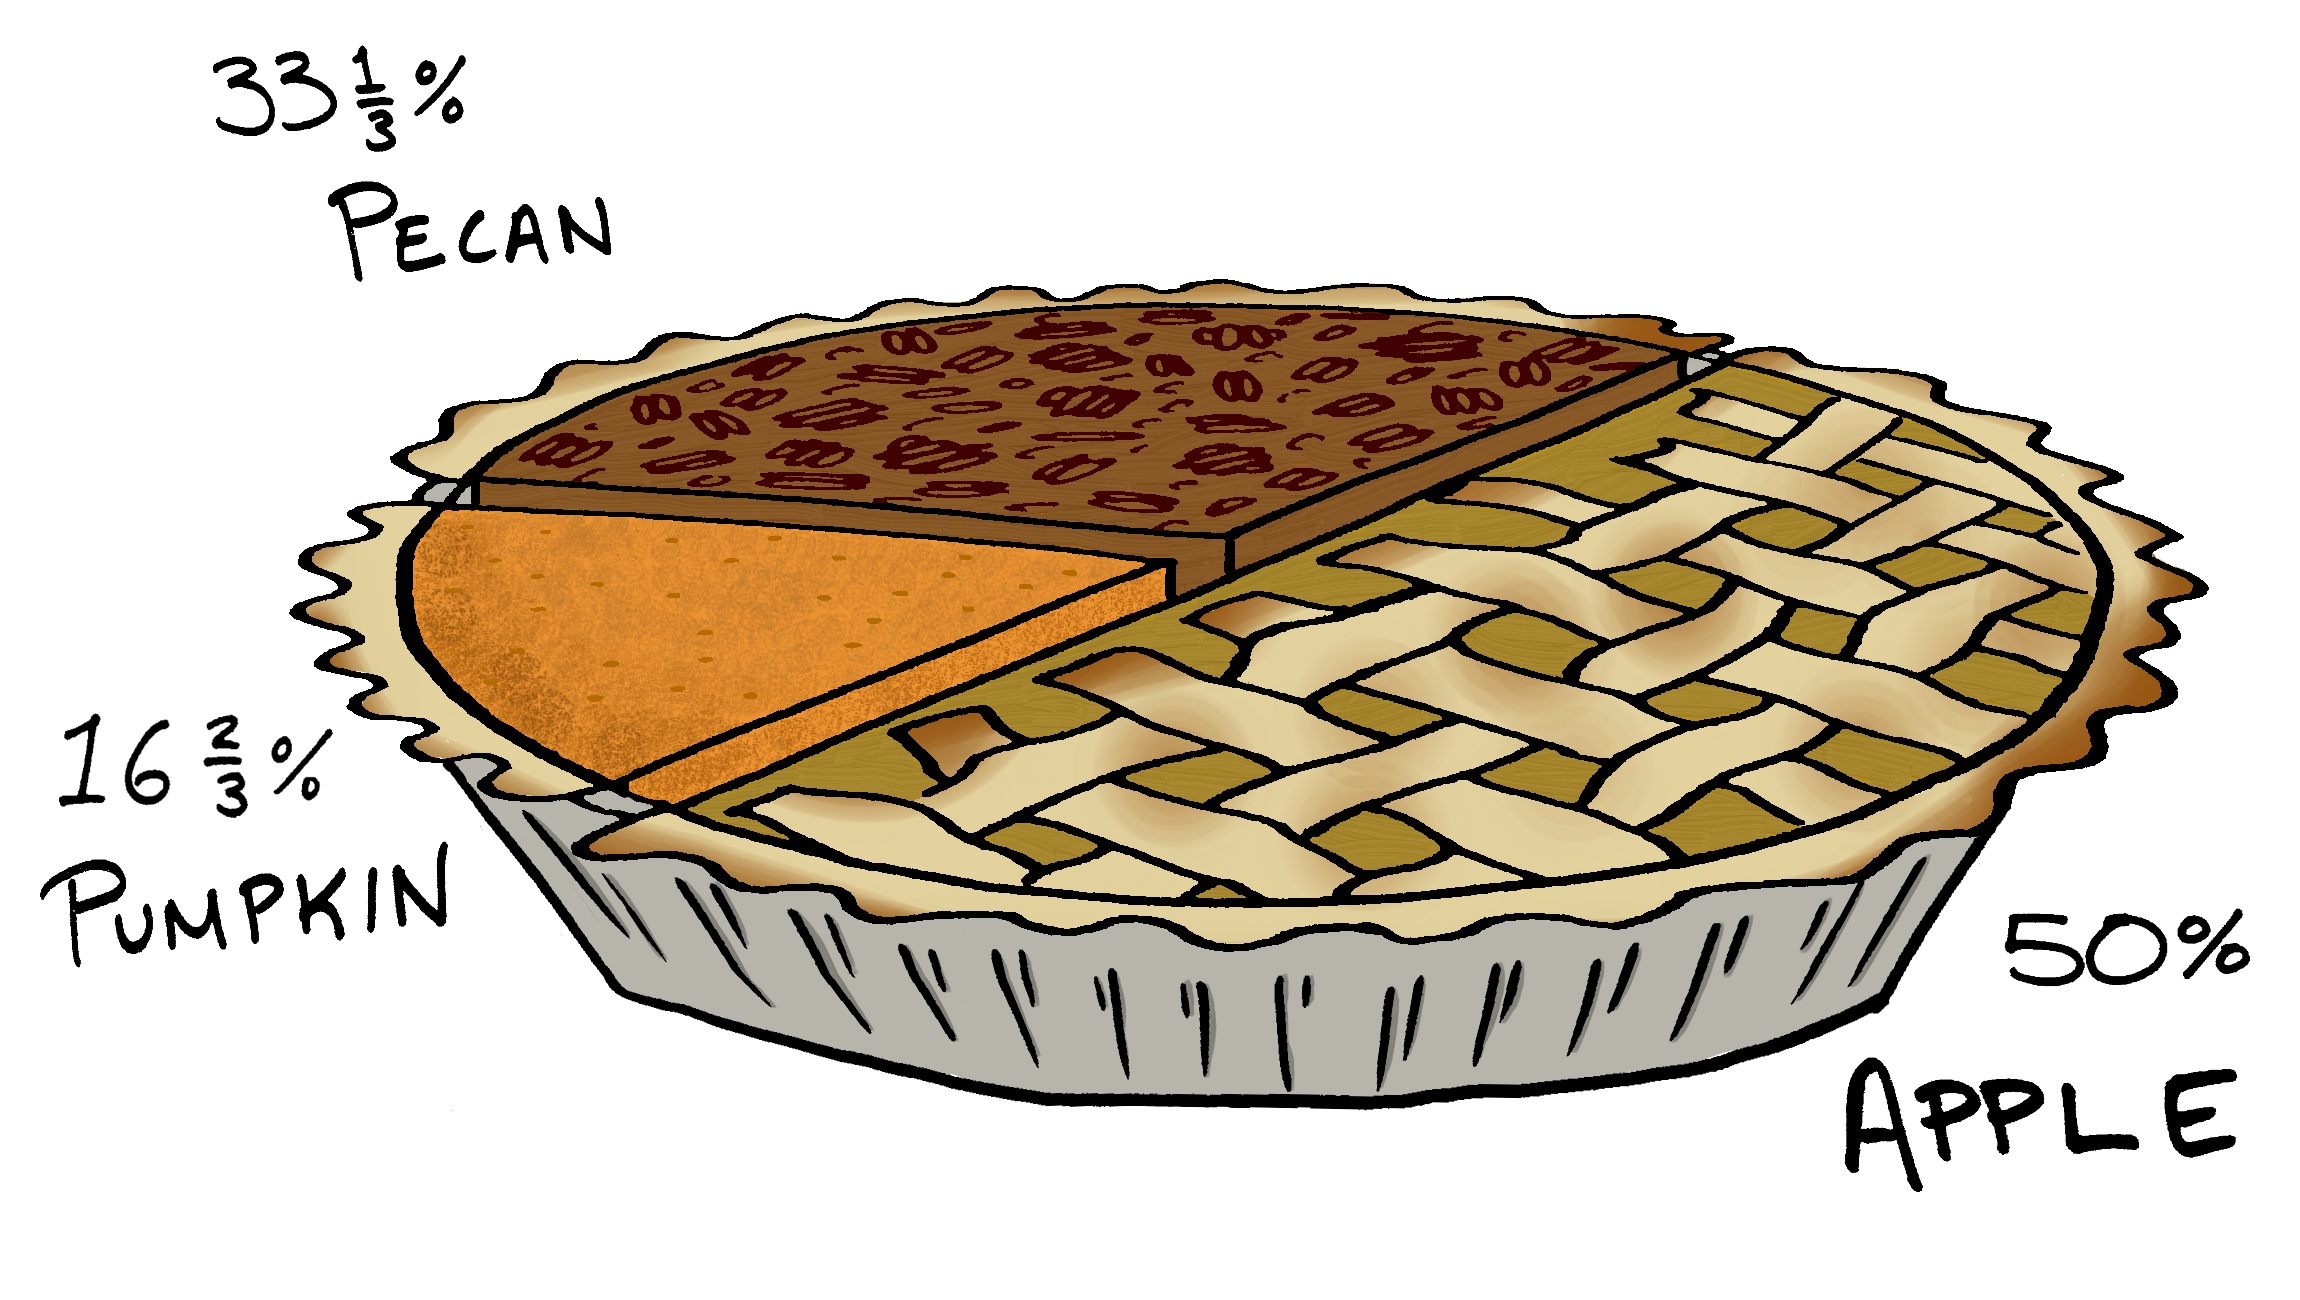
With fall in full swing and the holidays on the horizon, it isn’t surprising that we’ve been thinking a lot about pie lately, and by extension—you guessed it—pie charts! When conducting a survey, presenting your data (your results, the information you collected) visually helps you get a better sense of the “big picture” – how each piece of information relates to the group surveyed as a whole. A pie chart is one way to represent data visually.
As the name implies, a pie chart is circular, like most pies. The circle represents the whole group —100% of those surveyed. The chart is divided into sections—each “slice” of the “pie” is a part of that whole. The size of each slice is proportional to the quantity it represents. For instance, a slice representing 50% of the population would take up half of the chart. It will be twice as large as a slice representing 25% of the population, which would take up one fourth of the whole chart.
That said, give our pie chart word problem a try! We'll update this post with the answer tomorrow!
Students in Mrs. Campbell’s math class were surveyed on their favorite type of pie, with the results presented in the form of (you guessed it) a pie chart! 16 2/3% of the students prefer pumpkin pie. What fraction of the pie chart reflects the number of pumpkin pie lovers?
Pie Chart Fun Facts:
• The earliest recorded pie chart was created in 1801 by William Playfair.
• Pie charts are best used when displaying a relatively small amount of data—too many data “slices” can make it difficult to interpret the chart!
Can you think of other ways in which data is represented visually?
Update 11/10/15: The correct answer to our pie chart word problem is 1/6.


Mathnasium meets your child where they are and helps them with the customised program they need, for any level of mathematics.

